Lovion GRID CONTROL

Overview

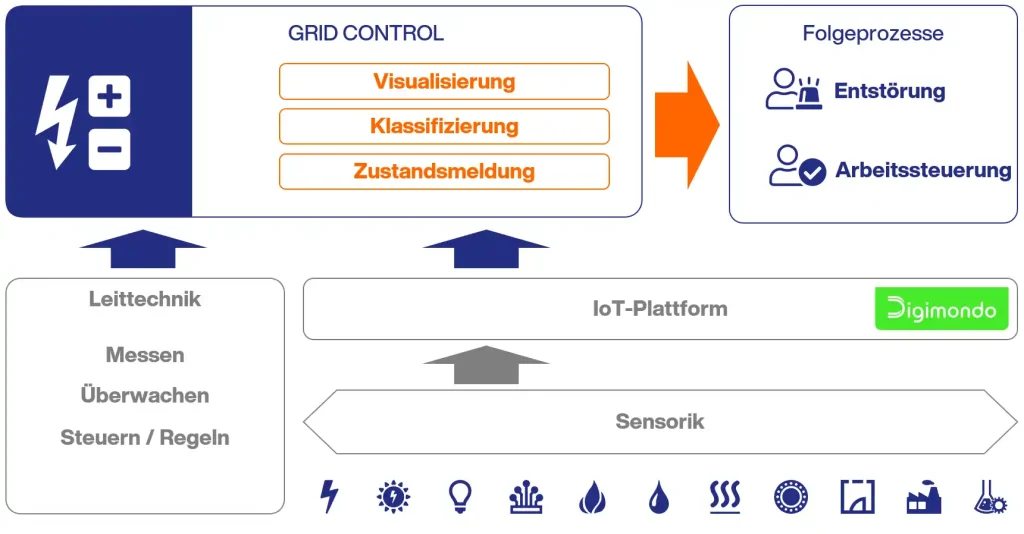
A smooth and efficient integration of sensor data is a prerequisite to efficiently digitise business processes. Furthermore, sensor notifications in technical IT systems also have to be visualised effectively.

Lovion GRID CONTROL is an innovative product that connects this gap between sensor data and a utility company’s technical business processes.

Flexible Sensor Data Integration

Sensor data is integrated into Lovion GRID CONTROL via a flexible user interface. This unique integration user interface is independent of components used to collect the sensor data.

As a result, sensor data can be integrated and visualised in Lovion GRID CONTROL no matter whether basic interfaces are used or RESTful web services.

Visualising Sensor Data

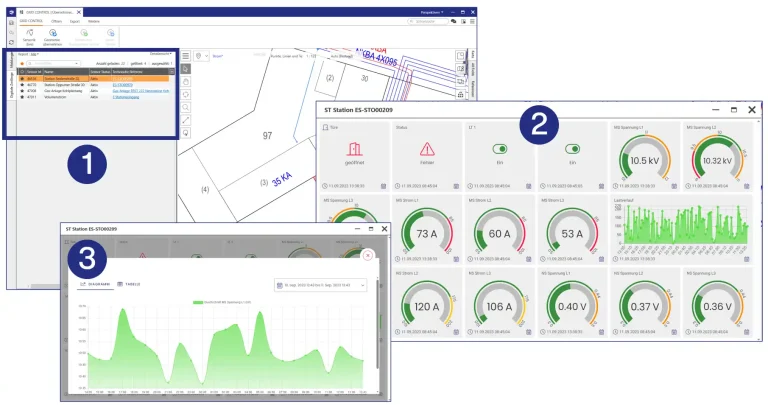
The core component of Lovion GRID CONTROL is the ability to flexibly visualise sensor data. By integrating this solution into the IoT platform Niotix by the company DIGIMONDO, a broad range of visualisation options are available.

By directly retrieving an asset’s digital twin in the Niotix platform, Lovion’s technical assets are perfectly complimented by visualisations provided by the IoT platform.

Sensor Data in detailed Maps

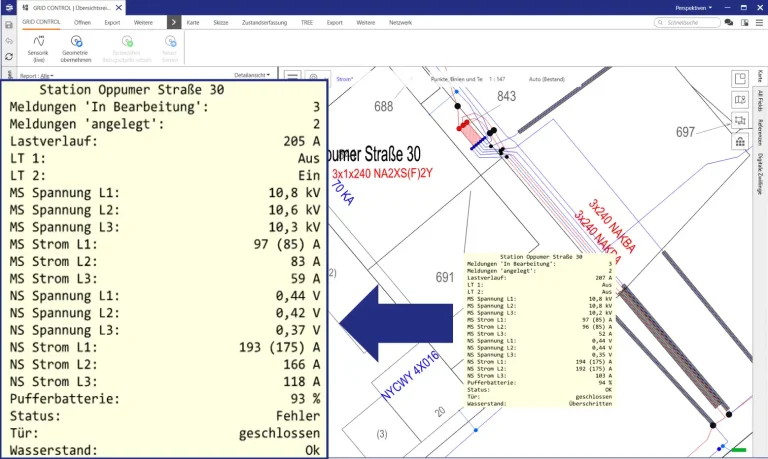
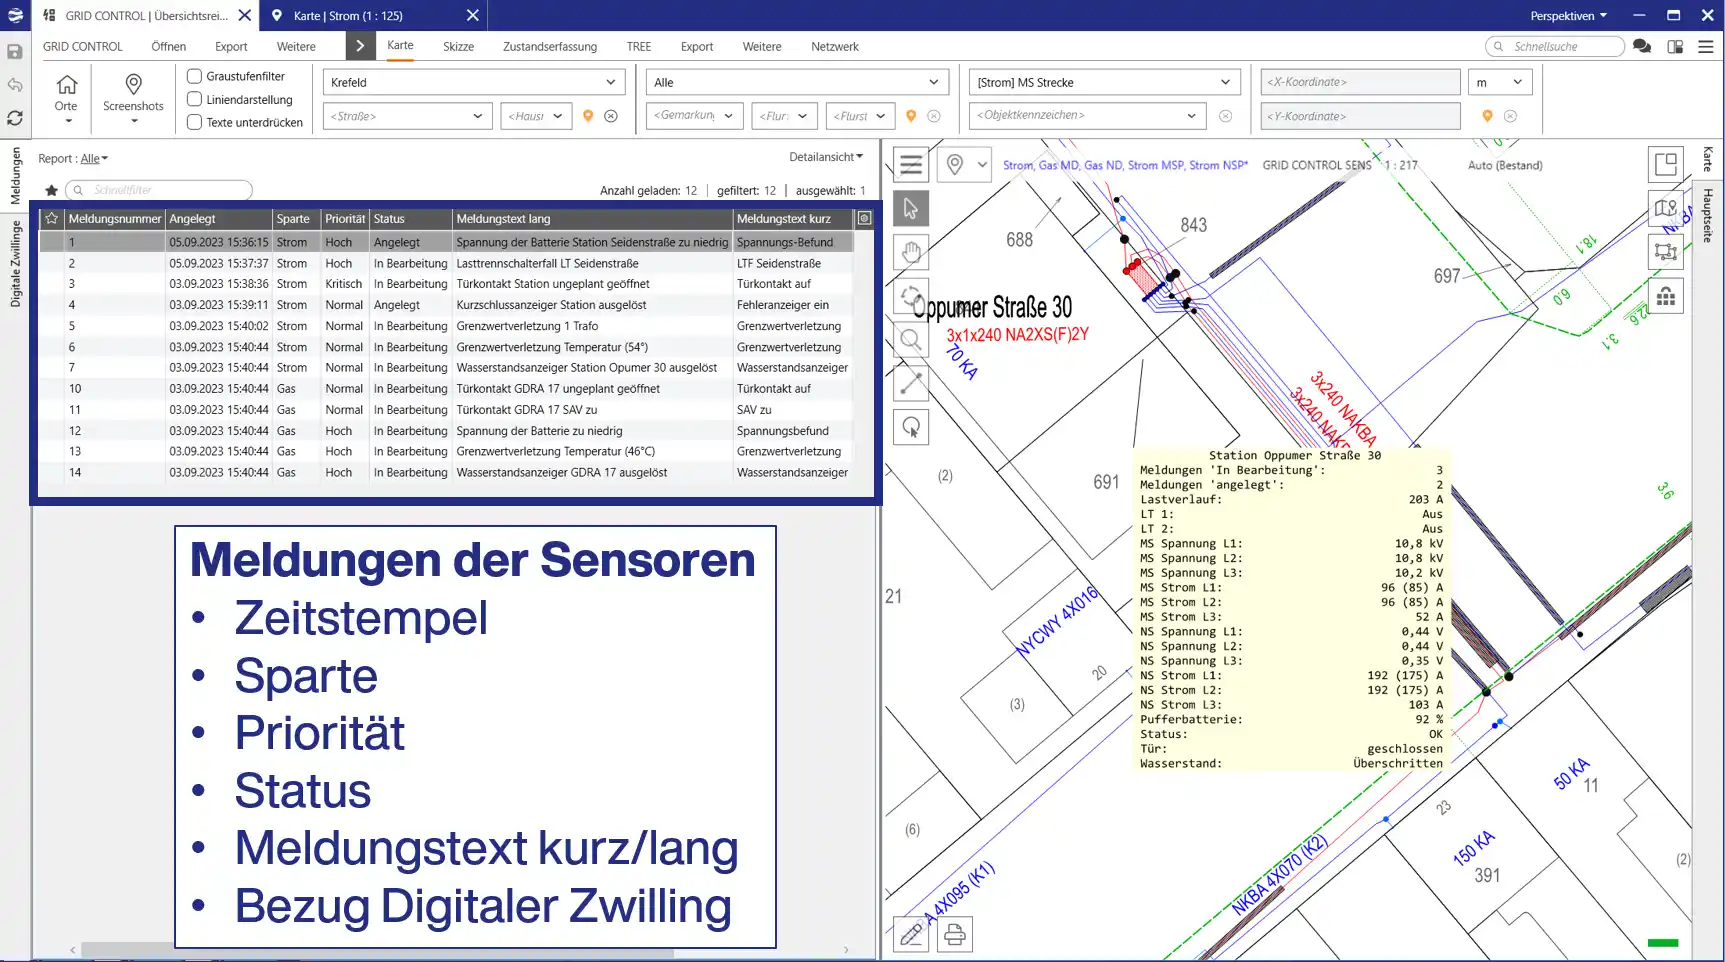
In addition to accessing these digital twins via the Lovion asset, it is also possible to display Niotix sensor data directly in the map.

The clear and straightforward visualisation of sensor data is supplemented with additional depictions of threshold values within the sensor data. Furthermore, notifications concerning status changes and threshold infringements are also displayed.

The overview map remains visible while sensor data can be displayed or hidden within the map.

Sensors in different Worlds

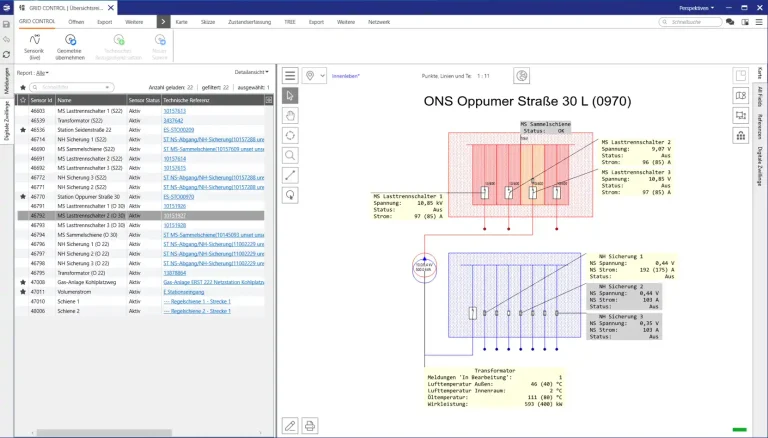
In order to support various use cases, Lovion GRID CONTROL also displays sensor data in different worlds. This includes geographic and thematic grid maps as well as internal worlds within utility plants such as electricity substations and cable distribution cabinets.

Furthermore, sensor data of digital twins can also be integrated into Lovion ASSET Plant depictions.

With this flexibility, it is possible to combine different visualisation options.

Integrating new Sensor Data

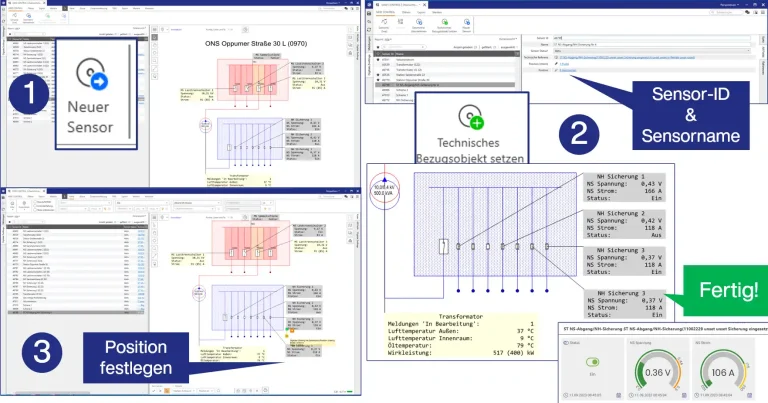
When integrating new sensors which are configured and compiled in the IoT platform Niotix, Lovion GRID CONTROL offers efficient integration functions. The connection between the Lovion asset and the digital twin is created through a user interface that contains a guided menu.

Thus, when sensors are quickly installed through massive rollouts, they can be effectively integrated into the solution by our customers.

Notification System

Another important functional component of Lovion GRID CONTROL next to sensor data visualisations are the notifications caused by status changes and threshold infringements detected by sensors.

These notifications can be imported from the IoT platform Niotix using preconfigured RESTful web services. For notifications deriving from other systems, Lovion’s integration platform can be used.

A central table for notifications displays all incoming notifications. Furthermore, a status model provides a better overview of the current notification status.

Benefits

Informationen zum Datenschutz findest Du in unserer Datenschutzerklärung.
* Pflichtfelder müssen ausgefüllt werden.

WEBINAR
Lovion GRID CONTROL

Save the date!

Wir freuen uns, dass Sie da sind!

Leider ist unsere Website nicht für den Internet Explorer konzipiert. Für eine optimale Darstellung empfehlen wir Ihnen einen aktuellen Browser zu verwenden!